Index
0 - Employment Numbers
A - Public Vs Private
1 - Graphs
2 - Health Care
3 - Middle Class Wealth
A - Reduced Standard of Living, Income and Savings
B - Consumer Debt/Debt
C - Class Polarization
4 - Poverty Rate
5 - General Economy and Inflation
A - Inflated prices in real estate
6 - Government Finances
7 - Expert Predictions
9 - Historical Similarities
10 - Cost of Regulations
11 - Cool Facts!
0 - Employment Numbers
Canada's economy has lost 26,000 jobs so far in 2013 as a whole.
Canada's economy lost 54,500 jobs in March.
Canadian economy shed 85,000 private sector positions (all of them full-time) in March.
The public sector barely changed and the difference came from a growth in self employment. Much of the losses came among those in the core working-age group of those between 25 and 54.
Link Job growth lags population growth
Job growth has lagged population growth, making the recovery incomplete. There are 1.4 million unemployed Canadians competing for jobs compared to 1.1 million prior to the crisis.
A - Public Vs Private
Link 12% more in salary alone
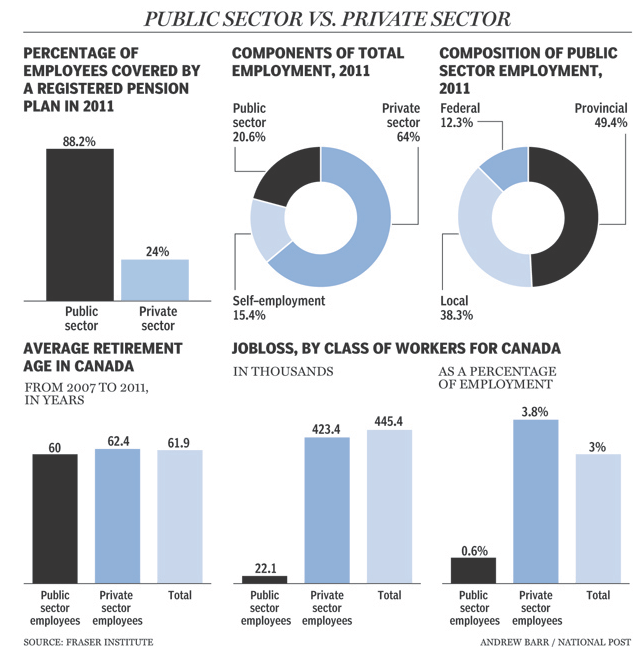
Canadian public-sector workers are paid 12% more than their private-sector counterparts, says a study released Thursday (2013) by the Fraser Institute.
Although the conservative think-tank said Statistics Canada did not record data in enough detail to make a more rigorous comparison, public workers probably also had better pensions and other non-wage benefits, such as shorter work weeks and earlier retirement.
If you just look at the coverage rate, basically 88% of the public sector has a registered pension, versus 24% in the private sector. Of those that have a pension [in the public sector], 94% are defined benefits, whereas only 53% are defined benefits in the private sector,” he said.
All told, taxpayers are on the hook for more than $1.5-billion in regular and voluntary severance to 102,589 public servants ($14,620 per person) in 2011-12, according to new federal numbers obtained by Postmedia News.
The government also is projecting it will spend at least another $850-million in the current 2012-13 fiscal year on accumulated severance payouts.
Business groups and spending watchdogs say the voluntary payouts are both “staggering” and “outrageous”.
Along with the more than $2-billion needed to cover the severance expenses for 2011-12 and 2012-13, the government also has earmarked $900-million to cover “workforce adjustment” payments owed to thousands of employees who will be laid off due to federal budget cuts.
Link Population of the federal public service 2012: 278,092
Link CCPA economist David Macdonald estimates that between 50,000 and 60,000 federal public sector jobs or private sector jobs funded by the government will be eliminated by 2014.
So if we take 55,000 to be the future federal job cut number, the $900 million will result in $16,360 per person.
1 - Graphs
Link Public vs Private (2013)
2 - Health Care
Consider waiting lists. In 2011, the median wait time from general practitioner referral to treatment by a specialist was 19 weeks in Canada. Despite substantial increases in both health spending and federal cash transfers to the provinces over the past 15 years, the 2011 wait time was 60 per cent longer than the 1997 median wait time of 11.9 weeks. In 2011, patients waited more than double the 9.3 weeks they would have waited in 1993. Our indicators are getting worse, not better.
Canada’s waiting lists are also among the longest in the developed world. For example, the 2010 findings from a survey of individuals in 11 nations, 10 of which maintain universal access health insurance programs. According to the Commonwealth Fund, among the 10 universal access nations surveyed (Australia, Canada, France, Germany, the Netherlands, New Zealand, Norway, Sweden, Switzerland, and the UK):
Canadians were the most likely to wait two months or more for a specialist appointment and least likely to wait less than one month for a specialist appointment; and
Canadians were the least likely to wait less than 30 minutes and most likely to wait four hours or more for access to an emergency room.
Link Socialist Universal Health Care doesn’t mean quick universal access to the best equipment but does mean high costs
Access to medical technologies is also relatively poor in Canada. In a recent comparison of inventories of medical technologies per one million people: in MRI machines, Canada ranked 15th of 26 OECD nations for whom data was available; 17th of 27 nations in CT scanners; 11th out of 24 in PET scanners; and 19th of 21 in lithotripters. Research also shows that Canada’s relatively small inventory of medical technologies consists of many old and outdated machines. Clearly, Canada’s relatively high expenditures neither buy quick access to care, nor do they buy high tech health care equipment and services for the population.
Link Socialist Universal Health Care does not mean universal health care
1.9 million Canadians can’t find a family physician
Government restrictions on medical training, along with a number of other policies that affect the practices of medical practitioners, have also taken their toll on Canadians’ access to health care. A recent comparison found Canada ranked 26th of 32 OECD nations for which data was available in the number of physicians per thousand population. It should come as no surprise that Statistics Canada determined that nearly 1.9 million Canadians aged 12 or older could not find a regular physician in 2009.
Link 2/3rd of Income tax going completely to paying for health care
While income taxes make up just 30 per cent of the tax bill for the average Canadian family, the amount of money spent on health care by Canada’s governments is equivalent to about two-thirds of all personal income taxes.
Link Socialized healthcare does not mean healthcare immune from market forces but instead a system more poorly equipped to deal with them - no such thing as free
The United Kingdom is the latest to tighten its belt. The National Health Service (NHS) — the centralized public agency that runs Britain’s government healthcare system — is being forced to shave $31 billion from its budget by 2015.
The Health Council of Canada recently surveyed over three thousand patients and found that those with chronic illnesses like high blood pressure or heart disease were largely dissatisfied with the medical care they received. Less than half of respondents with such conditions reported that the care they received was excellent or very good.
But aren’t they getting it for free? Shouldn’t they be grateful?
Not really. Despite the massive taxes Canadians remit to finance universal care, they still must pay out of pocket for some services. Nearly a quarter of chronically ill respondents said that they had skipped their medications or neglected to fill a prescription because it was too expensive.
A significant number of Canadians—an estimated 44,794 in total—received treatment outside Canada in 2010. This is a notable increase from the 41,006 Canadians estimated to have received treatment outside Canada in 2009. The national increase in the estimated number of patients treated outside Canada occurred at the same time as a national increase in the median wait time for medically necessary treatment. Specifically, the national median wait time for treatment after consultation with a specialist was 8.0 weeks in 2009 and 9.3 weeks in 2010.
In 2011, a significant number of Canadians—an estimated 46,159—received
treatment outside of the country. At the same time, the national median wait time for treatment after consultation with a specialist increased from 9.3 weeks in 2010 to 9.5 weeks in 2011
3 - Middle Class Wealth
A - Reduced Standard of Living, Income and Savings
More and more seniors are working longer. The percentage of those aged 60-64 who are employed rose from 34% in 1989 to 47% in 2011 ... a new record. The percentage of those aged 65-69 who are still working jumped from 11% in 1989 to 23% in 2011 ... another new record. The percentage of the 70 and over group who are still working increased to 6% in 2011 ... one more record high.
Over the 1989 to 2011 period, the labour force aged 45-54 more than doubled (+108%), those aged 55-64 also more than doubled (+133%) while those aged 65 and older grew even faster (+180%).
The median earnings of full-time Canadian workers increased by just $53 annually—that's right, $53 annually—between 1980 and 2005
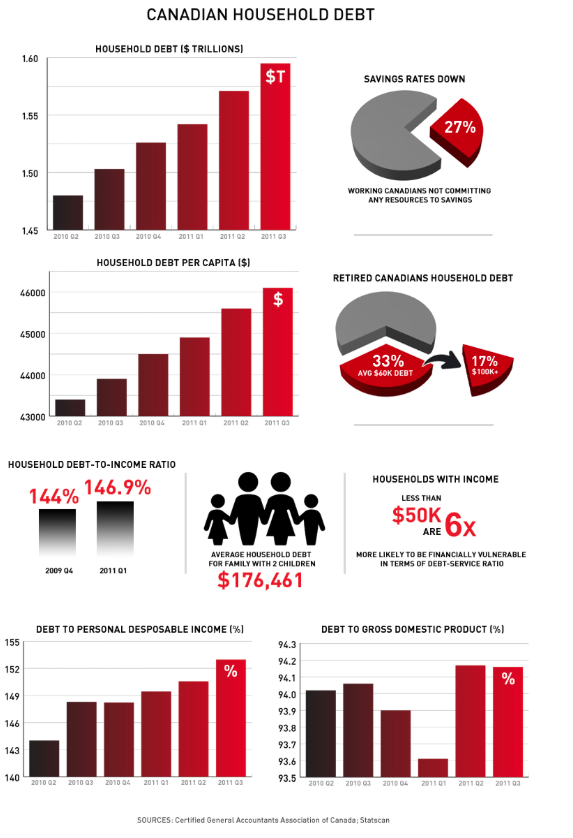
B - Consumer Debt/Debt
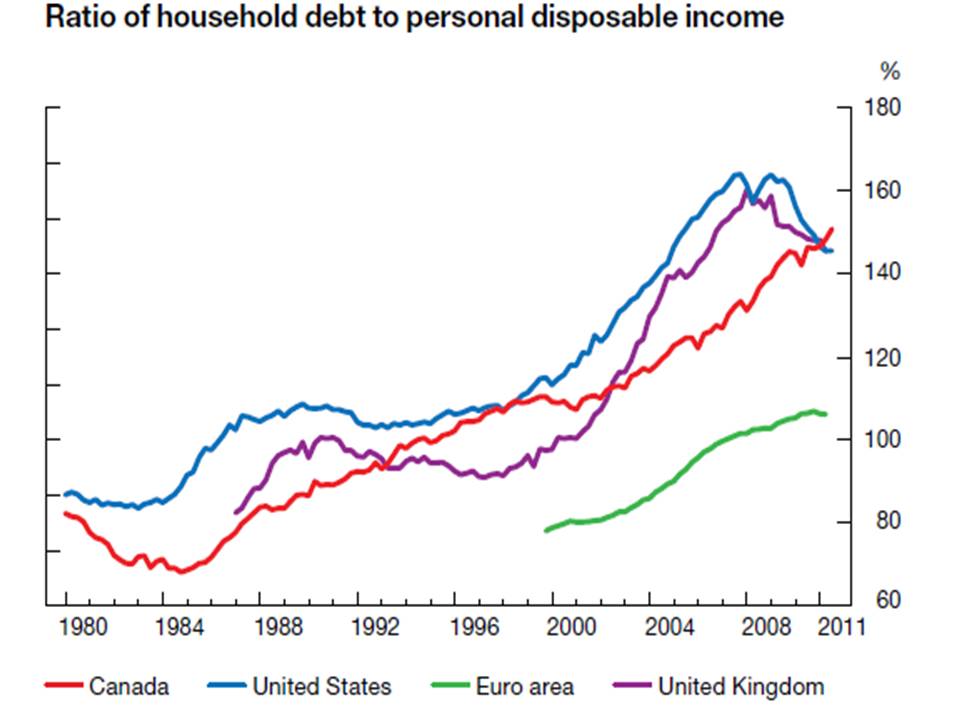
Experts say nervous consumers won't spend enough to provide a significant boost to the economy, especially as households have a record C$1.65 of debt for every dollar earned.
Canadian household debt has reached an all-time high, but in 2012 Canadians still took on more. Consumer debt jumped 6 per cent last year. Analysts are growing concerned that Canadian consumers are over-leveraged and will eventually have to make steep cuts to their spending.
Business investment remains slow and outgoing Bank of Canada Governor Mark Carney wants the private sector to unleash some of what he has called the "dead money" to stimulate the economy.
But companies need to put cash in a "war fund" until better times, said Betty Lou Pacey, founder and chief executive officer of BL Innovative Lighting, a small Vancouver-based business that exports optical fiber for lighting.
She cites the massive U.S. fiscal deficit as the biggest external threat for exporters, whose sales growth depends on healthy U.S. demand. Her own company has a couple of costly projects "percolating" that would be easier to commit to if circumstances were better.

C - Class Polarization
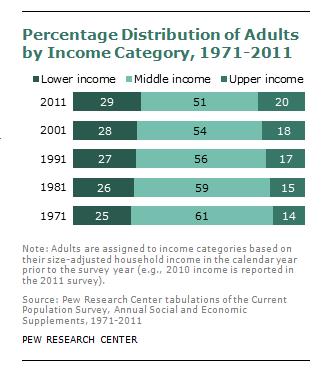
The report from the OECD said the top 1% of Canadians saw their share of the country’s total income increased to 13.3% in 2007 from only 8.1% in 1980. And the very richest of Canadians, the top 0.1%, had their share of income more than double, to 5.3% from 2%.
Overall, the top 10% of Canadians in 2008 earned $103,500 on average, 10 times higher than the bottom 10%, who made an average of $10,260. This is up from a ratio of 8 to 1 in the early 1990s and higher than the overall OECD average.
Link Multi-Decade increase in income inequality
The higher up the income scale, the more dramatic the gains. For the richest one per cent, the share of all Canadian incomes almost doubled between the late 1970s and 2007. For the richest 0.1 per cent of tax files, their total share almost tripled during those 20 years. And for the creme-de-la-creme — the richest 0.01 per cent making more than $640,000 a year — their share of total incomes more than quintupled.
Link Between 1980 and 2005, median earnings among Canada's top earners rose more than 16 per cent while those in the bottom fifth saw their wages dip by 20 per cent.
In its report, called Oh Canada! Too Many Children in Poverty for Too Long, the advocacy group Campaign 2000 says First Nations children are suffering the greatest levels of poverty of all children in the country.
McMaster University study (2010) finds a 21-year difference in life expectancy between the poorest neighbourhood and the wealthiest neighbourhood in Hamilton, Ontario.
4 - Poverty Rate
In 2012, a record 882,000 Canadians used food banks each month, the highest level of food bank usage ever (Food Banks Canada), in 2011 the number was only slight lower at 851,014 – which is still 26% above the 2008 levels (Hunger Count 2011).
The number of Ontario residents on welfare jumped by more than 63,200 last year.
The social assistance caseload increased by about 20% between November 2008 and November 2009, according to the latest government figures available.
The number of people on welfare in B.C. has risen significantly, as the slumping economy takes its toll leaving many who could work unable to find jobs.
The latest numbers from the Ministry of Housing and Social Development show the number of people on social assistance who were able and expected to work has increased 49.8 per cent in the last six months.
Out of 25 developed countries, Canada ties for last place for failing to attain nine of UNICEF’s ten benchmark indicators of quality and access to early childhood education and care (ECEC) provision.
- One aboriginal child in eight is disabled, double the rate of all children in Canada.
- Among First Nations children, 43 per cent lack basic dental care.
- Overcrowding among First Nations families is double the rate of that for all Canadian families.
- Mould contaminates almost half of all First Nations households.
- Almost half of aboriginal children under 15 years old residing in urban areas live with a single parent.
- Close to 100 First Nations communities must boil their water.
- Of all off-reserve aboriginal children, 40 per cent live in poverty.
The biggest revenue source is transfers from the federal government.
In 1988, amendments to the Indian Act empowered First Nations with their own tax authority and today, according to Wilson, about one-sixth of bands collect taxes.
Link Isolated to reserves through government force
There are exemptions under the Indian Act. The act says that the "personal property of an Indian or a band situated on a reserve" is tax exempt. Métis and Inuit are not eligible for this exemption.
The act says that a Status Indian working on a reserve is exempt from income taxes.
And Status Indians do not generally pay the federal goods and services tax or provincial sales tax if they buy something on a reserve or if it is destined for a reserve.
"Off-reserve, we all get stuck with it," notes Restoule.
One must remember that every time someone leaves the reserve, the cost and obligation of the federal government for each of those individual is reduced by about 80%. What would motivate the federal government to make things better on reserves? Aboriginal leaders tell me the on-reserve population is continuing to grow despite the number of people leaving. We know that from the Department of Indian Affairs spending reports that for every $8.00 spent on reserves only $1.00 is spent on services to those 60% of the band membership that lives off reserve. Seems a little backward to me.
The deteriorating circumstances include grinding poverty, tainted water not suitable for drinking or bathing in more than 100 communities at any given time, major housing crisis, loss of language, extreme crime rates, rampant health epidemics, youth suicide rates eight times the national average. For Inuit youth, living in the remote and rugged Arctic, the suicide rate is 40 times the national average.
Link Aboriginal children more likely to die relative to rest of population
Aboriginal children in Canada die from unintentional injuries at rates three to four times higher than the national average, new research shows.
While injuries are the leading cause of death for all Canadian children, they affect aboriginal kids disproportionately, according to the Canadian Paediatric Society.
In some areas of Manitoba, Saskatchewan and British Columbia, the injury-related death rate for First Nations children is 6.5 times that of the general population. For certain injuries, the death rate is as high as 22 times the Canadian average.
The study, written by Toronto pediatrician Dr. Anna Banerji, also found that it's not just children who are dying at a disproportionate rate. Unintentional injuries cause 6% of deaths in Canada, but 26% of all aboriginal deaths.
To commemorate the 20th anniversary of Parliament’s resolution to end child poverty in Canada, Campaign 2000 released its annual report card on child and family poverty in Canada. Today in 2009 an Aboriginal child is 12.3 times more likely to be in foster care than a non-Aboriginal child. While comprising only 3.8 per cent of the Canadian population, poverty has resulted in Aboriginal children accounting for a staggering 30 per cent of children in foster care. The situation is so grave that the number of Aboriginal children in the child welfare system today is three times the number enrolled in residential schools at the height of their operation.
In Canada, being Aboriginal often means being poor, or even very poor. In 2005, 3.8% of the country’s population identified as Aboriginal, either as North American Indians (or First Nations peoples; 60% of the total), Me´tis (33%) or Inuit (4%).1 Of these, 21.7% had incomes below Statistics Canada’s low income cut-off after tax, compared to 11.1% for the non-Aboriginal identity population
Employment rate of Aboriginal peoples being almost ten percentage points below that of the non-Aboriginal population (53.7% compared to 62.7% in 2005)
Basic education, for instance, was not as likely to be achieved, 43.7% of Aboriginal Canadians having less than a secondary education, compared to 23.1% for the non-Aboriginal population.
The Poor Law relief system, not the welfare state, then inspired social policy toward Indians, and until the introduction of universal family allowances in 1945, relief came mostly from the provision by the Department of Indian Affairs.
By 1990, 28.6% of Aboriginal identity persons over 15 years old received social assistance. For Indians on reserve, the rate was even higher, at 41.5%
Social assistance, noted with regret the Royal Commission on Aboriginal Peoples “has become the staple of many Aboriginal communities” and “contributed to the persistence of individual and community economic dependency”
In 2003, 34.8% of Indians on reserve received social assistance, compared to 5.5% for the country’s general population (excluding Indians on reserve). In Manitoba, this rate for on-reserve Indians was 43.9%
52.1% of all aboriginal children were poor, the highest rate of the three equity groups above. Aboriginal people had a disability rate that was more than twice the national average. Aboriginal children were four times more likely to be hungry.
Fewer Aboriginal children aged 14 and under lived with two parents in 2001 than did non-Aboriginal children.
32% of Aboriginal children living on reserves, and 46% of Aboriginal children in the census metropolitan areas, lived with a lone parent.
Only 17% of non-Aboriginal children lived with a lone parent
Twice the proportion of Aboriginal children lived with a lone parent in 2001 as did non-Aboriginal children.
5% of Aboriginals living in large urban areas lived with a relative other than their parent(s), or lived with a non-relative.
12% of Aboriginal families are headed by parents under the age of 25 years;
27% of Aboriginal families are headed by single mothers;
40% of single Aboriginal mothers earn less than $12,000 per year;
One report revealed that the average number of Aboriginal welfare recipients has risen from 40 to 41 percent over a 10 year period beginning 1988-89.
For 45 percent of Canada's First Nations people, social assistance is their only source of income.
Link Including aboriginal population the percentage of the Canadian population on welfare in March 2005 was 5.2%.
Community destruction: "Welfare isn't a part of First Nation culture" I've heard many Elders say. They can recall the first person in their community to get welfare. "Our community has never been the same," they say and add, "We used to help each other out, support ourselves, not any more, not after welfare."
Professional development destruction: Welfare becomes the family tradition like Sunday dinners. Instead of the children adopting the role of community hunter or healer or fisher or weaver, as their ancestors once did, the occupation becomes welfare. A new family tradition is formed. Children learn from their parents. Social assistance has become an acceptable way of life for too many people and their families. While for centuries children have been encouraged to adopt the occupation of their parents, children of social assistance parents are too following in the footsteps of their parents creating inter-generational welfare families.
For more than a century, education for on-reserve Aboriginal children was primarily provided through church-run residential schools designed to assimilate Aboriginal children into both Caucasian culture and the churches.
Church-run: Not really > Link (The Indian residential schools of Canada were a network of "residential" (boarding) schools for Aboriginal peoples of Canada (First Nations [formerly "Indians"],Metis, and Inuit [formerly "Eskimos"]) funded by the Canadian government's Department of Indian Affairs, and administered by Christian churches)
The children were forbidden to speak their own languages, practice their spiritual traditions, or maintain their cultural traditions. Schools were usually too far from reserves to enable contact with parents. Siblings were separated in residence. Sexual and physical abuse and death from disease were common.
Children in residential schools did not en-counter healthy parental role models and, as adults, frequently had diminished capacity to care for their own children.
The last residential school closed in Saskatchewan in 1996
National statistics document an 80.9 percent increase in the number of days that First Nations children spent in group or institutional care during this period. This increase is dramatic when compared to the corresponding figure for the number of days spent in foster care (37.4 percent increase).
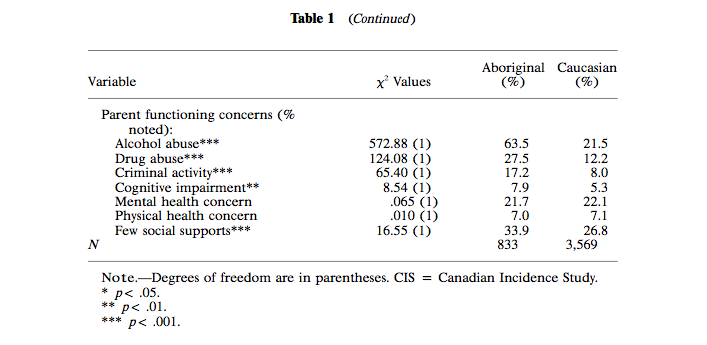
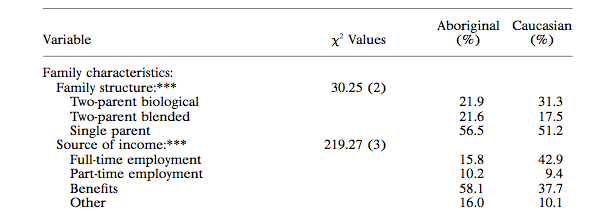
Look at where the income is coming from:
5 - General Economy and Inflation
Factory sales plunged 3.1% to 48.02 billion Canadian dollars (US$47.94 billion), marking the deepest one-month decline in 43 months, or since the midst of the great recession.
Much of December’s weakness was due to auto-plant shutdowns in Ontario, but even excluding that sector Canadian factory shipments fell 1.8%.
The flipside of Canadians' explosive debt burden is consumer spending, which is now showing weakness as debt loads continue to grow. Retail sales over the crucial holiday season posted an unexpected 2.1-per-cent decline this past December, signalling that the Canadian consumer may be running out of steam, and finally reigning in those debts.
A recent CIBC study estimated that austerity measures will shave 0.9 per cent off government spending, which in turn will translate into a 0.2 per cent drag on Canada's GDP.
Canadian companies' business investment plans are at their lowest non-recession point since 1995, an alarm bell for the economy because investment is so important to the creation of new jobs and future profits.
Canadian exports fell 2.8 per cent in the last month of 2012, a sign that Canada's largest trading partner, the U.S., is still struggling to sustain growth. But with Asia experiencing a slowdown and Europe continuing to muddle through its debt crisis, the odds of a pick-up in demand for Canadian exports are slim.
After eight years of decline, the manufacturing sector created only 15,900 jobs in 2011. Employment in 2011 was about where it was in 1993 and down by 532,200 jobs since the peak in 2004.
Link A single but scary and telling case (Reuters)
The 50-year-old was laid off last year from his job of 22 years at a bus-assembly plant northwest of Toronto, and has since applied for 130 jobs. His best offer: A job at $12 an hour, half his previous wage and not enough to pay his bills.
House prices in Canada suffered six straight months of declines before leveling off in April, according to Teranet. But sales volumes have dropped sharply over the past year —down 15.3 per cent from a year earlier, according to the latest numbers — and the supply of homes available on the market is growing relative to the number of buyers -- a bad sign for future prices.
Capital Markets predicting a 25-per-cent drop in house prices, and The Economist indicating Canada has one of the most overvalued housing markets in the world.
Canada Mortgage and Housing Corp. predicts construction of new homes will fall 11 per cent this year. That could be bad news for the economy, as Canada has come to be more reliant on real estate and construction-related activity than it has been in recorded history. The "FIRE" industries -- finance, insurance and real estate -- amount to 27 per cent of the economy, up from a long term average of 24. A construction slowdown could translate into big job losses.
6 - Government Finances
7 - Expert Predictions
Global investors are turning against Canada’s economy, placing some of the largest bets on record that the country’s housing market, financial sector and currency are in for a rough ride.
A report Monday in The Financial Post indicates that a near-record amount of money is being placed against Canada’s major banks.
The length of time it would require investors shorting Canadian banks to cover their debts if the stock went up is now at 10.3 days, compared to just 1.3 days for U.S. banks. Any ratio above five suggests investors are pessimistic.
That follows a report last week that the Canadian dollar has become the second-most shorted major global currency, after the Japanese yen, suggesting investors widely expect the Canadian dollar to keep sliding.
Several trends appear to be behind the negative sentiment, including a weakening housing market and falling prices for commodities such as oil and gold. Both of these trends could impact the country’s economy, given Canada’s well-known reliance on commodities, and given that housing now supports a greater percentage of Canadian jobs than it has in recent history.
San Francisco-based Hyphen Partners LP is putting 95 per cent of its clients’ assets into bets against Canada’s housing market and banks.
“Canada faces two risks,” Hyphen Partners head Vijai Mohan told the Globe, referring to housing and banks. “Very few people are looking at those risks simultaneously. That collectively presents a lot of opportunity” for those who wish to make money off the Canadian’s economy’s expected decline.
9 - Historical Similarities
10 - Cost of Regulations
Link Canadian companies pay more for regulation than American ones
Most Canadian small businesses pay much more than their U.S. counterparts to comply with regulatory requirements, according to CFIB’s 2013 version of Canada’s Red Tape Report.
The smallest businesses in Canada (fewer than five employees) pay 45% more per employee ($5,942) to comply with government regulation than their U.S counterparts ($4,084).
The total cost of regulation to Canadian businesses is $31 billion a year.
In addition, Canadians spent more hours a year to comply with regulations compared with the U.S. (171 hours for companies with fewer than five employees versus 130).
Productivity growth in Canada was 0.7% between 2001 and 2011, well below the U.S. with 1.8% and OECD average of 1.4%, data from the Organization of Economic Co-operation and Development shows.
11 - Cool Facts!
$1 invested in early years (before the age of 6) saves $9 in future spending on health, welfare and justice systems (Report on Public Health in Canada).
Support the show, using a variety of donation methods
Support the show


Recent Comments